
Saturating Forecasts
Forecasting Growth
By default, Prophet uses a linear model for its forecast. When forecasting growth, there is usually some maximum achievable point: total market size, total population size, etc. This is called the carrying capacity, and the forecast should saturate at this point.
Prophet allows you to make forecasts using a logistic growth trend model, with a specified carrying capacity. We illustrate this with the log number of page visits to the R (programming language) page on Wikipedia:
1
2
# R
df <- read.csv('https://raw.githubusercontent.com/facebook/prophet/main/examples/example_wp_log_peyton_manning.csv')
1
2
# Python
df = pd.read_csv('https://raw.githubusercontent.com/facebook/prophet/main/examples/example_wp_log_peyton_manning.csv')
We must specify the carrying capacity in a column cap. Here we will assume a particular value, but this would usually be set using data or expertise about the market size.
1
2
# R
df$cap <- 8.5
1
2
# Python
df['cap'] = 8.5
The important things to note are that cap must be specified for every row in the dataframe, and that it does not have to be constant. If the market size is growing, then cap can be an increasing sequence.
We then fit the model as before, except pass in an additional argument to specify logistic growth:
1
2
# R
m <- prophet(df, growth = 'logistic')
1
2
3
# Python
m = Prophet(growth='logistic')
m.fit(df)
We make a dataframe for future predictions as before, except we must also specify the capacity in the future. Here we keep capacity constant at the same value as in the history, and forecast 5 years into the future:
1
2
3
4
5
# R
future <- make_future_dataframe(m, periods = 1826)
future$cap <- 8.5
fcst <- predict(m, future)
plot(m, fcst)
1
2
3
4
5
# Python
future = m.make_future_dataframe(periods=1826)
future['cap'] = 8.5
fcst = m.predict(future)
fig = m.plot(fcst)
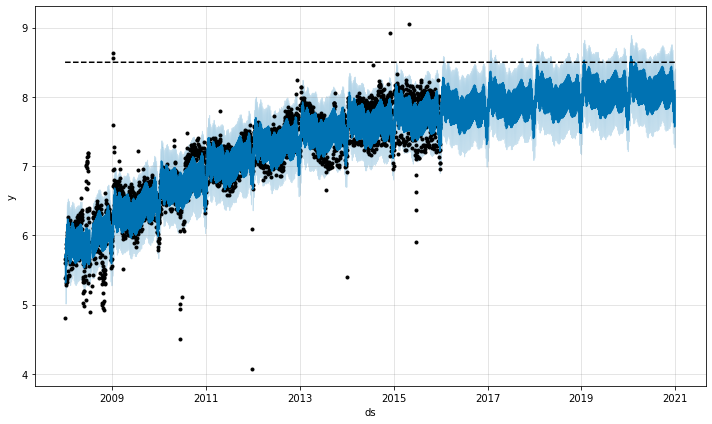
The logistic function has an implicit minimum of 0, and will saturate at 0 the same way that it saturates at the capacity. It is possible to also specify a different saturating minimum.
Saturating Minimum
The logistic growth model can also handle a saturating minimum, which is specified with a column floor in the same way as the cap column specifies the maximum:
1
2
3
4
5
6
7
8
9
# R
df$y <- 10 - df$y
df$cap <- 6
df$floor <- 1.5
future$cap <- 6
future$floor <- 1.5
m <- prophet(df, growth = 'logistic')
fcst <- predict(m, future)
plot(m, fcst)
1
2
3
4
5
6
7
8
9
10
# Python
df['y'] = 10 - df['y']
df['cap'] = 6
df['floor'] = 1.5
future['cap'] = 6
future['floor'] = 1.5
m = Prophet(growth='logistic')
m.fit(df)
fcst = m.predict(future)
fig = m.plot(fcst)
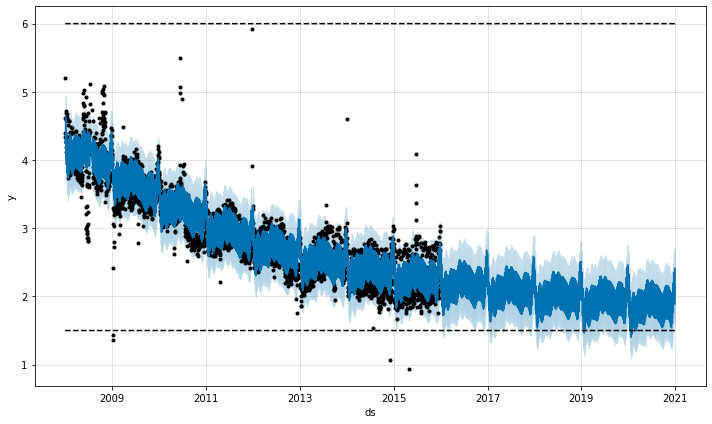
To use a logistic growth trend with a saturating minimum, a maximum capacity must also be specified.