Outliers
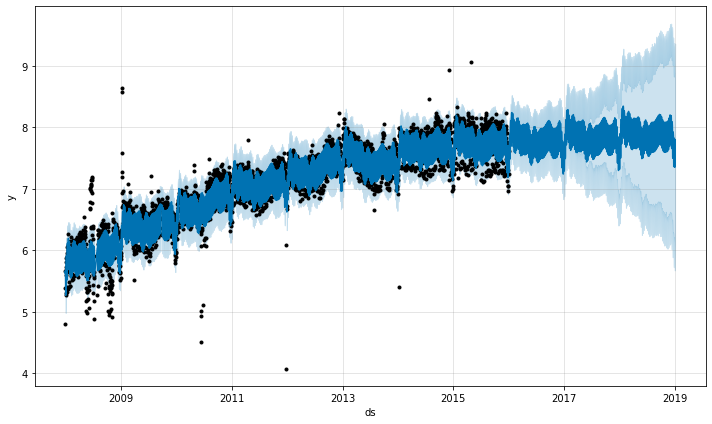
There are two main ways that outliers can affect Prophet forecasts. Here we make a forecast on the logged Wikipedia visits to the R page from before, but with a block of bad data:
1
2
3
4
5
6
# R
df <- read.csv('https://raw.githubusercontent.com/facebook/prophet/main/examples/example_wp_log_R_outliers1.csv')
m <- prophet(df)
future <- make_future_dataframe(m, periods = 1096)
forecast <- predict(m, future)
plot(m, forecast)
1
2
3
4
5
6
7
# Python
df = pd.read_csv('https://raw.githubusercontent.com/facebook/prophet/main/examples/example_wp_log_R_outliers1.csv')
m = Prophet()
m.fit(df)
future = m.make_future_dataframe(periods=1096)
forecast = m.predict(future)
fig = m.plot(forecast)
The trend forecast seems reasonable, but the uncertainty intervals seem way too wide. Prophet is able to handle the outliers in the history, but only by fitting them with trend changes. The uncertainty model then expects future trend changes of similar magnitude.
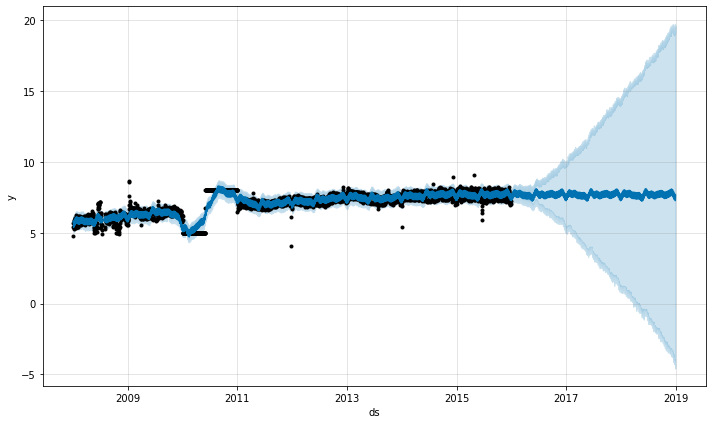
The best way to handle outliers is to remove them - Prophet has no problem with missing data. If you set their values to NA in the history but leave the dates in future, then Prophet will give you a prediction for their values.
1
2
3
4
5
6
7
# R
outliers <- (as.Date(df$ds) > as.Date('2010-01-01')
             & as.Date(df$ds) < as.Date('2011-01-01'))
df$y[outliers] = NA
m <- prophet(df)
forecast <- predict(m, future)
plot(m, forecast)
1
2
3
4
# Python
df.loc[(df['ds'] > '2010-01-01') & (df['ds'] < '2011-01-01'), 'y'] = None
model = Prophet().fit(df)
fig = model.plot(model.predict(future))
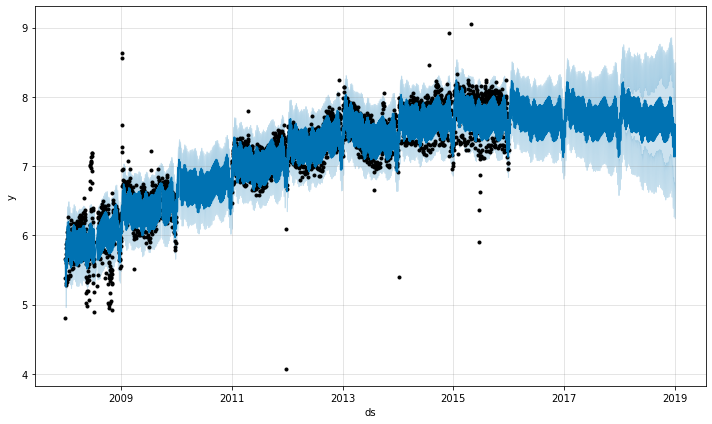
In the above example the outliers messed up the uncertainty estimation but did not impact the main forecast yhat. This isn’t always the case, as in this example with added outliers:
1
2
3
4
5
6
# R
df <- read.csv('https://raw.githubusercontent.com/facebook/prophet/main/examples/example_wp_log_R_outliers2.csv')
m <- prophet(df)
future <- make_future_dataframe(m, periods = 1096)
forecast <- predict(m, future)
plot(m, forecast)
1
2
3
4
5
6
7
# Python
df = pd.read_csv('https://raw.githubusercontent.com/facebook/prophet/main/examples/example_wp_log_R_outliers2.csv')
m = Prophet()
m.fit(df)
future = m.make_future_dataframe(periods=1096)
forecast = m.predict(future)
fig = m.plot(forecast)
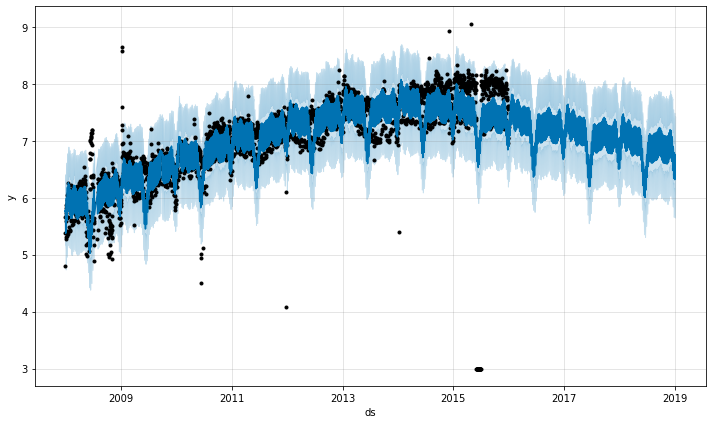
Here a group of extreme outliers in June 2015 mess up the seasonality estimate, so their effect reverberates into the future forever. Again the right approach is to remove them:
1
2
3
4
5
6
7
# R
outliers <- (as.Date(df$ds) > as.Date('2015-06-01')
             & as.Date(df$ds) < as.Date('2015-06-30'))
df$y[outliers] = NA
m <- prophet(df)
forecast <- predict(m, future)
plot(m, forecast)
1
2
3
4
# Python
df.loc[(df['ds'] > '2015-06-01') & (df['ds'] < '2015-06-30'), 'y'] = None
m = Prophet().fit(df)
fig = m.plot(m.predict(future))