
Multiplicative Seasonality
By default Prophet fits additive seasonalities, meaning the effect of the seasonality is added to the trend to get the forecast. This time series of the number of air passengers is an example of when additive seasonality does not work:
1
2
3
4
5
6
# R
df <- read.csv('https://raw.githubusercontent.com/facebook/prophet/main/examples/example_air_passengers.csv')
m <- prophet(df)
future <- make_future_dataframe(m, 50, freq = 'm')
forecast <- predict(m, future)
plot(m, forecast)
1
2
3
4
5
6
7
# Python
df = pd.read_csv('https://raw.githubusercontent.com/facebook/prophet/main/examples/example_air_passengers.csv')
m = Prophet()
m.fit(df)
future = m.make_future_dataframe(50, freq='MS')
forecast = m.predict(future)
fig = m.plot(forecast)
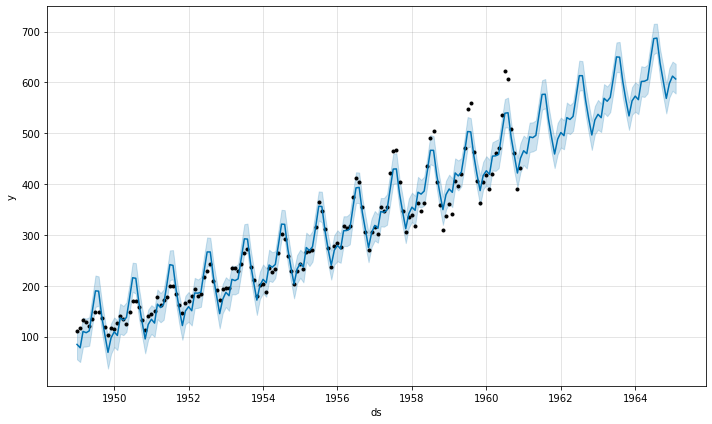
This time series has a clear yearly cycle, but the seasonality in the forecast is too large at the start of the time series and too small at the end. In this time series, the seasonality is not a constant additive factor as assumed by Prophet, rather it grows with the trend. This is multiplicative seasonality.
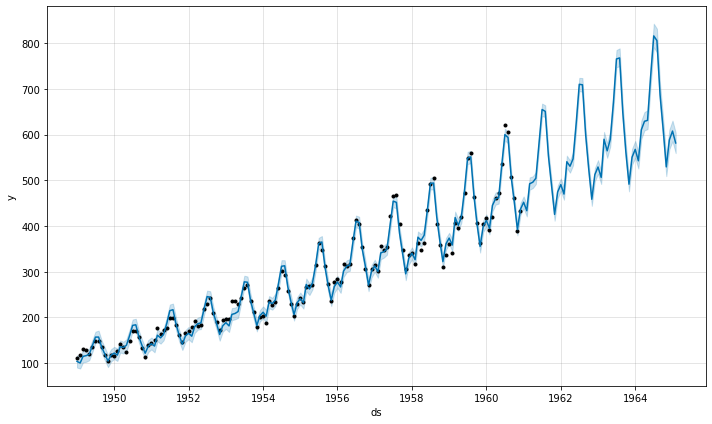
Prophet can model multiplicative seasonality by setting seasonality_mode='multiplicative' in the input arguments:
1
2
3
4
# R
m <- prophet(df, seasonality.mode = 'multiplicative')
forecast <- predict(m, future)
plot(m, forecast)
1
2
3
4
5
# Python
m = Prophet(seasonality_mode='multiplicative')
m.fit(df)
forecast = m.predict(future)
fig = m.plot(forecast)
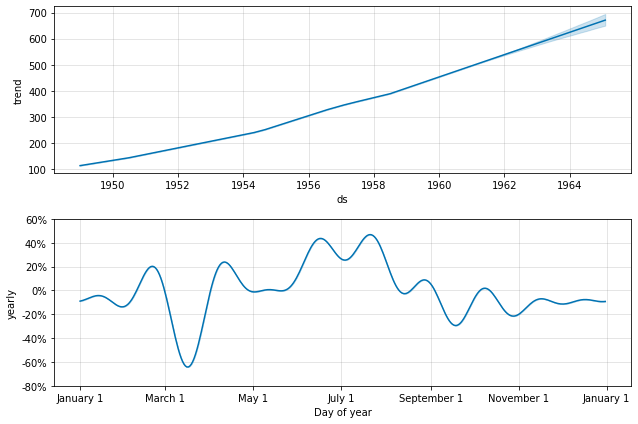
The components figure will now show the seasonality as a percent of the trend:
1
2
# R
prophet_plot_components(m, forecast)
1
2
# Python
fig = m.plot_components(forecast)
With seasonality_mode='multiplicative', holiday effects will also be modeled as multiplicative. Any added seasonalities or extra regressors will by default use whatever seasonality_mode is set to, but can be overriden by specifying mode='additive' or mode='multiplicative' as an argument when adding the seasonality or regressor.
For example, this block sets the built-in seasonalities to multiplicative, but includes an additive quarterly seasonality and an additive regressor:
1
2
3
4
# R
m <- prophet(seasonality.mode = 'multiplicative')
m <- add_seasonality(m, 'quarterly', period = 91.25, fourier.order = 8, mode = 'additive')
m <- add_regressor(m, 'regressor', mode = 'additive')
1
2
3
4
# Python
m = Prophet(seasonality_mode='multiplicative')
m.add_seasonality('quarterly', period=91.25, fourier_order=8, mode='additive')
m.add_regressor('regressor', mode='additive')
Additive and multiplicative extra regressors will show up in separate panels on the components plot. Note, however, that it is pretty unlikely to have a mix of additive and multiplicative seasonalities, so this will generally only be used if there is a reason to expect that to be the case.