
Non-Daily Data
Sub-daily data
Prophet can make forecasts for time series with sub-daily observations by passing in a dataframe with timestamps in the ds column. The format of the timestamps should be YYYY-MM-DD HH:MM:SS - see the example csv here. When sub-daily data are used, daily seasonality will automatically be fit. Here we fit Prophet to data with 5-minute resolution (daily temperatures at Yosemite):
1
2
3
4
5
6
# R
df <- read.csv('https://raw.githubusercontent.com/facebook/prophet/main/examples/example_yosemite_temps.csv')
m <- prophet(df, changepoint.prior.scale=0.01)
future <- make_future_dataframe(m, periods = 300, freq = 60 * 60)
fcst <- predict(m, future)
plot(m, fcst)
1
2
3
4
5
6
# Python
df = pd.read_csv('https://raw.githubusercontent.com/facebook/prophet/main/examples/example_yosemite_temps.csv')
m = Prophet(changepoint_prior_scale=0.01).fit(df)
future = m.make_future_dataframe(periods=300, freq='H')
fcst = m.predict(future)
fig = m.plot(fcst)
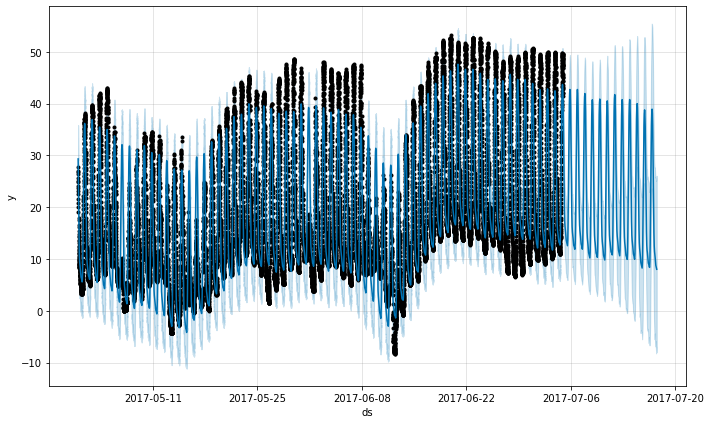
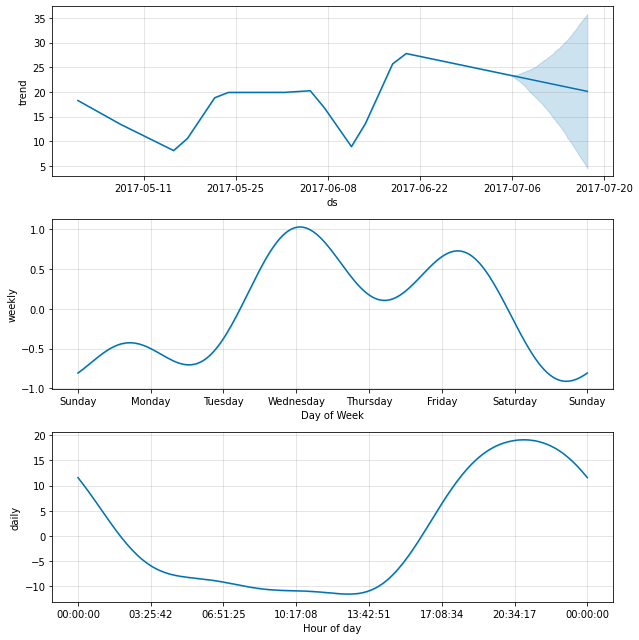
The daily seasonality will show up in the components plot:
1
2
# R
prophet_plot_components(m, fcst)
1
2
# Python
fig = m.plot_components(fcst)
Data with regular gaps
Suppose the dataset above only had observations from 12a to 6a:
1
2
3
4
5
6
7
8
# R
df2 <- df %>%
  mutate(ds = as.POSIXct(ds, tz="GMT")) %>%
  filter(as.numeric(format(ds, "%H")) < 6)
m <- prophet(df2)
future <- make_future_dataframe(m, periods = 300, freq = 60 * 60)
fcst <- predict(m, future)
plot(m, fcst)
1
2
3
4
5
6
7
8
# Python
df2 = df.copy()
df2['ds'] = pd.to_datetime(df2['ds'])
df2 = df2[df2['ds'].dt.hour < 6]
m = Prophet().fit(df2)
future = m.make_future_dataframe(periods=300, freq='H')
fcst = m.predict(future)
fig = m.plot(fcst)
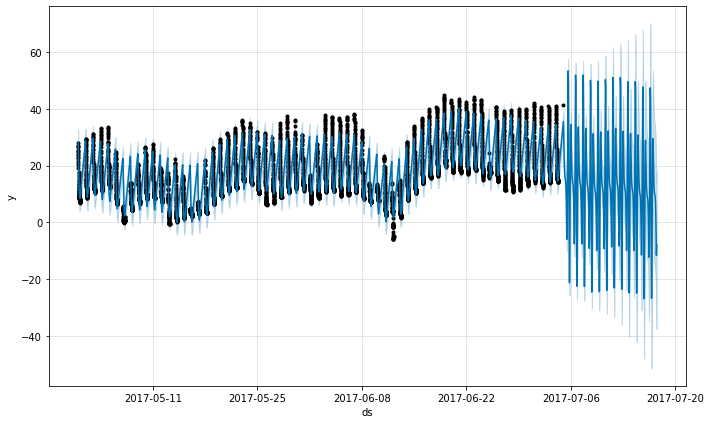
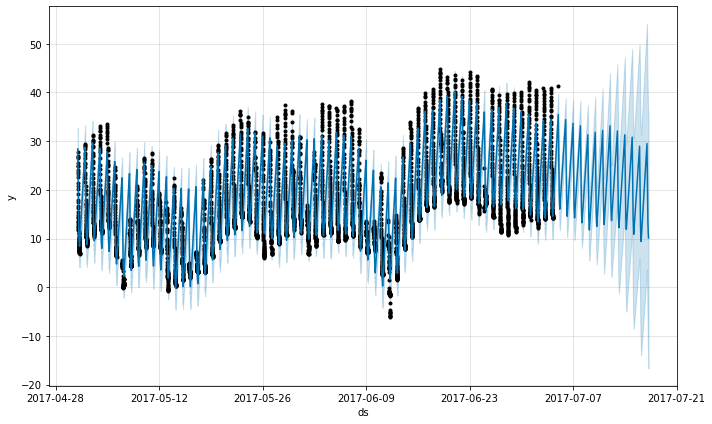
The forecast seems quite poor, with much larger fluctuations in the future than were seen in the history. The issue here is that we have fit a daily cycle to a time series that only has data for part of the day (12a to 6a). The daily seasonality is thus unconstrained for the remainder of the day and is not estimated well. The solution is to only make predictions for the time windows for which there are historical data. Here, that means to limit the future dataframe to have times from 12a to 6a:
1
2
3
4
5
# R
future2 <- future %>%
  filter(as.numeric(format(ds, "%H")) < 6)
fcst <- predict(m, future2)
plot(m, fcst)
1
2
3
4
5
# Python
future2 = future.copy()
future2 = future2[future2['ds'].dt.hour < 6]
fcst = m.predict(future2)
fig = m.plot(fcst)
The same principle applies to other datasets with regular gaps in the data. For example, if the history contains only weekdays, then predictions should only be made for weekdays since the weekly seasonality will not be well estimated for the weekends.
Monthly data
You can use Prophet to fit monthly data. However, the underlying model is continuous-time, which means that you can get strange results if you fit the model to monthly data and then ask for daily forecasts. Here we forecast US retail sales volume for the next 10 years:
1
2
3
4
5
6
# R
df <- read.csv('https://raw.githubusercontent.com/facebook/prophet/main/examples/example_retail_sales.csv')
m <- prophet(df, seasonality.mode = 'multiplicative')
future <- make_future_dataframe(m, periods = 3652)
fcst <- predict(m, future)
plot(m, fcst)
1
2
3
4
5
6
# Python
df = pd.read_csv('https://raw.githubusercontent.com/facebook/prophet/main/examples/example_retail_sales.csv')
m = Prophet(seasonality_mode='multiplicative').fit(df)
future = m.make_future_dataframe(periods=3652)
fcst = m.predict(future)
fig = m.plot(fcst)
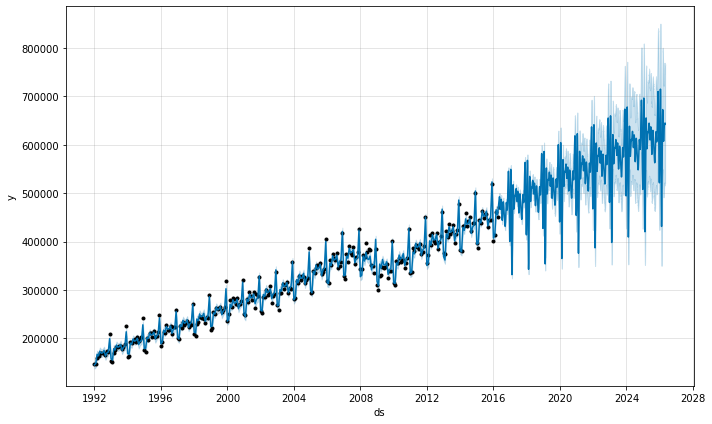
This is the same issue from above where the dataset has regular gaps. When we fit the yearly seasonality, it only has data for the first of each month and the seasonality components for the remaining days are unidentifiable and overfit. This can be clearly seen by doing MCMC to see uncertainty in the seasonality:
1
2
3
4
# R
m <- prophet(df, seasonality.mode = 'multiplicative', mcmc.samples = 300)
fcst <- predict(m, future)
prophet_plot_components(m, fcst)
1
2
3
4
# Python
m = Prophet(seasonality_mode='multiplicative', mcmc_samples=300).fit(df, show_progress=False)
fcst = m.predict(future)
fig = m.plot_components(fcst)
1
2
WARNING:pystan:481 of 600 iterations saturated the maximum tree depth of 10 (80.2 %)
WARNING:pystan:Run again with max_treedepth larger than 10 to avoid saturation
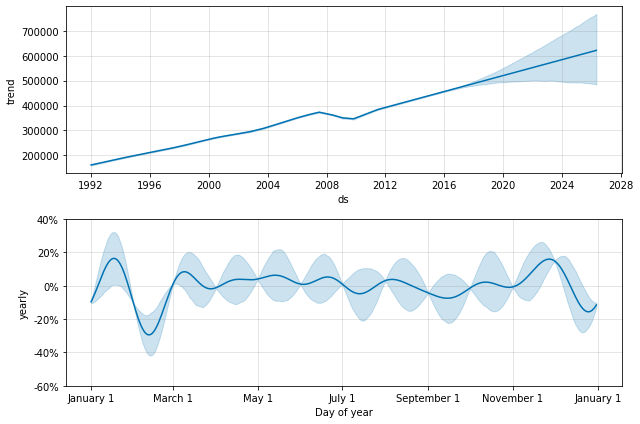
The seasonality has low uncertainty at the start of each month where there are data points, but has very high posterior variance in between. When fitting Prophet to monthly data, only make monthly forecasts, which can be done by passing the frequency into make_future_dataframe:
1
2
3
4
# R
future <- make_future_dataframe(m, periods = 120, freq = 'month')
fcst <- predict(m, future)
plot(m, fcst)
1
2
3
4
# Python
future = m.make_future_dataframe(periods=120, freq='MS')
fcst = m.predict(future)
fig = m.plot(fcst)
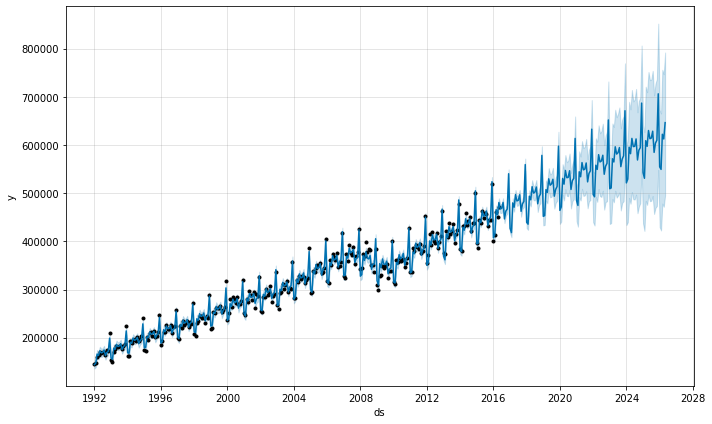
In Python, the frequency can be anything from the pandas list of frequency strings here: https://pandas.pydata.org/pandas-docs/stable/user_guide/timeseries.html#timeseries-offset-aliases . Note that MS used here is month-start, meaning the data point is placed on the start of each month.
In monthly data, yearly seasonality can also be modeled with binary extra regressors. In particular, the model can use 12 extra regressors like is_jan, is_feb, etc. where is_jan is 1 if the date is in Jan and 0 otherwise. This approach would avoid the within-month unidentifiability seen above. Be sure to use yearly_seasonality=False if monthly extra regressors are being added.
Holidays with aggregated data
Holiday effects are applied to the particular date on which the holiday was specified. With data that has been aggregated to weekly or monthly frequency, holidays that don’t fall on the particular date used in the data will be ignored: for example, a Monday holiday in a weekly time series where each data point is on a Sunday. To include holiday effects in the model, the holiday will need to be moved to the date in the history dataframe for which the effect is desired. Note that with weekly or monthly aggregated data, many holiday effects will be well-captured by the yearly seasonality, so added holidays may only be necessary for holidays that occur in different weeks throughout the time series.