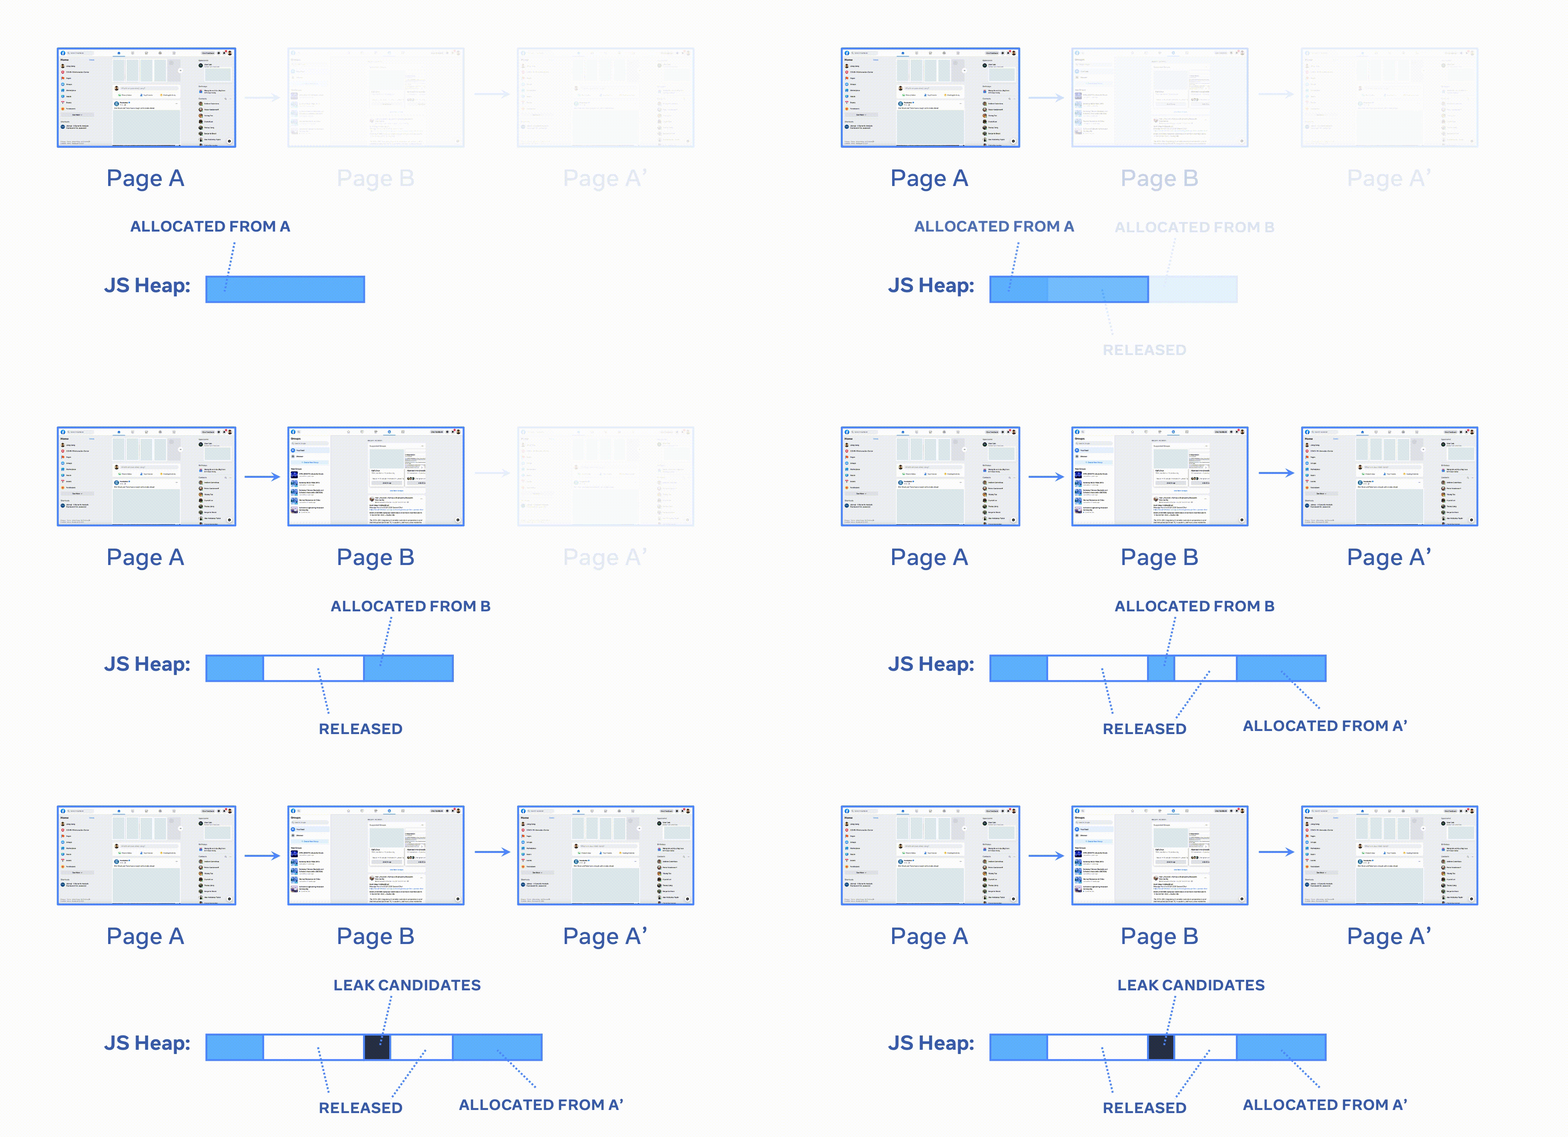
How memlab Works
In a nutshell, memlab starts a headless Chrome browser, interacts with the page, takes heap snapshots, and finds memory leaks by parsing, diffing, and analyzing heap snapshots.
1. Browser Interaction
For example, if we want to find memory leaks triggered by some interactions
in a web app on a target page (TP), memlab visits the web page in the
following order:
- Visit a different page - let's call it baseline page
BPand take a heap snapshot namedSBP(the baseline page is specified by theurlcallback in test scenario) - Visit the target page
TPor trigger the target interactions and take another heap snapshotSTP(navigating to the target page or triggering the target interactions are specified by theactioncallback in test scenario) - Finally, navigate to a different page or use any in-page interaction to
trigger the releasing of memory that is supposed to be released from the
target page. Here we reach the final state (
FP), and take the final heap snapshotSFP. For example, in this step, you can close the widget opened by the target interactions, or return to the baseline page. (the final navigation or interaction is specified by thebackcallback in test scenario)
With these heap snapshots, memlab finds memory leaks as explained in the next section.
2. Heap Analysis
Snapshot decoding: memlab decodes V8 (or hermes) heap snapshots and provides APIs that allows querying JavaScript heap.
Leak detection: A superset of objects leaked from the target page can be derived as follows:
(STP \ SBP) ∩ SFP
MemLab first gets a set of allocated objects in TP (target interaction)
by excluding SBP's objects (object allocated from the baseline page)
from STP (target heap snapshot).
Then it takes an intersection with objects in FP (object remaining on the
final page) to get objects that:
- are allocated from target interaction (
TP) - but remain alive when those objects are supposed to be released.
The built-in leak detectors use domain-specific heuristics to further refine the list of leaked objects (e.g., detached DOM elements, error stack trace, etc. memlab also identifies React Fiber tree and detects unmounted Fiber nodes).
3. Retainer Traces for Memory Leaks
memlab generates retainer traces from GC roots to leaked objects. Sometimes certain interactions could trigger thousands of leaked objects, it would be overwhelming to show all the retainer traces. memlab clusters all retainer traces and only shows one retainer trace for each memory leak cluster.

In the animation, A represents the BP (baseline page), B represents the TP (target page), and A' represents the FP (final page).