Find memory leaks in JavaScript
Analyzes JavaScript heap and finds memory leaks in browser and node.js
$ npm install -g memlab$ memlab run --scenario test.jsMemLab found 46 leak(s)--Similar leaks in this run: 4----Retained size of leaked objects: 8.3MB--[Window](native) @35847 [8.3MB]--20 (element)---> [InternalNode](native) @130981728--1 (element)---> [EventListener](native) @131009888--context (internal)---> [<function scope>](object) @181905--bigArray (variable)---> [Array](object) @182925 [8.3MB]
Finding leaks in production at





Features
Everything you need to chase down memory
From automated end-to-end leak detection to low-level heap analysis — in the browser, in Node.js, and in CI.
Browser leak detection
Drive your app with the Puppeteer API. memlab diffs the heap snapshots, filters out the noise, and clusters what actually leaked.
Heap traversal API
An object-oriented API over snapshots from Chromium, Node.js, Electron.js, and Hermes — build your own leak detectors.
Memory CLI toolbox
Built-in analyses for duplicate strings, oversized objects, and unbound growth — optimization wins beyond leaks.
MemLens debugging
Visualize leaks and debug them interactively in the browser, without leaving the page you are testing.
Assertions in Node.js
Let unit tests snapshot their own heap and assert that objects are gone — catch regressions in CI, not in production.
MCP server for AI agents
Hand heap snapshots to Claude Code, Cursor, or any MCP client and investigate memory in plain English.
How it works
Three steps to a leak trace
Write a scenario, run it, and read the reference chain that keeps your objects alive.
Define your test
Describe the interaction you want to check for leaks.
// test.jsfunction url() {return 'https://www.google.com/maps';}async function action(page) {await page.click('text/Hotels');}async function back(page) {await page.click('[aria-label="Close"]');}module.exports = {action, back, url};
Run memlab in the CLI
One command drives the browser and reports leak traces.
$ memlab run --scenario test.js
# Analyze duplicated strings in the heap$ memlab analyze string# Check unbound object growth$ memlab analyze unbound-object# Get shapes with unbound growth$ memlab analyze unbound-shape# Discover more memory analyses$ memlab analyze -h
Or use the API
Take snapshots and find leaks programmatically.
const {findLeaks, takeSnapshots} = require('@memlab/api');async function test() {const scenario = {url: () => 'https://www.facebook.com',};const result = await takeSnapshots({scenario});const leaks = findLeaks(result);// ...}
Retainer traces
See exactly what is holding memory
memlab walks the reference chain from the GC root down to the leaked object, so you know which reference to break instead of guessing. Similar leaks are clustered, so 46 leaked objects become a handful of real bugs to fix.
Read the debugging guide →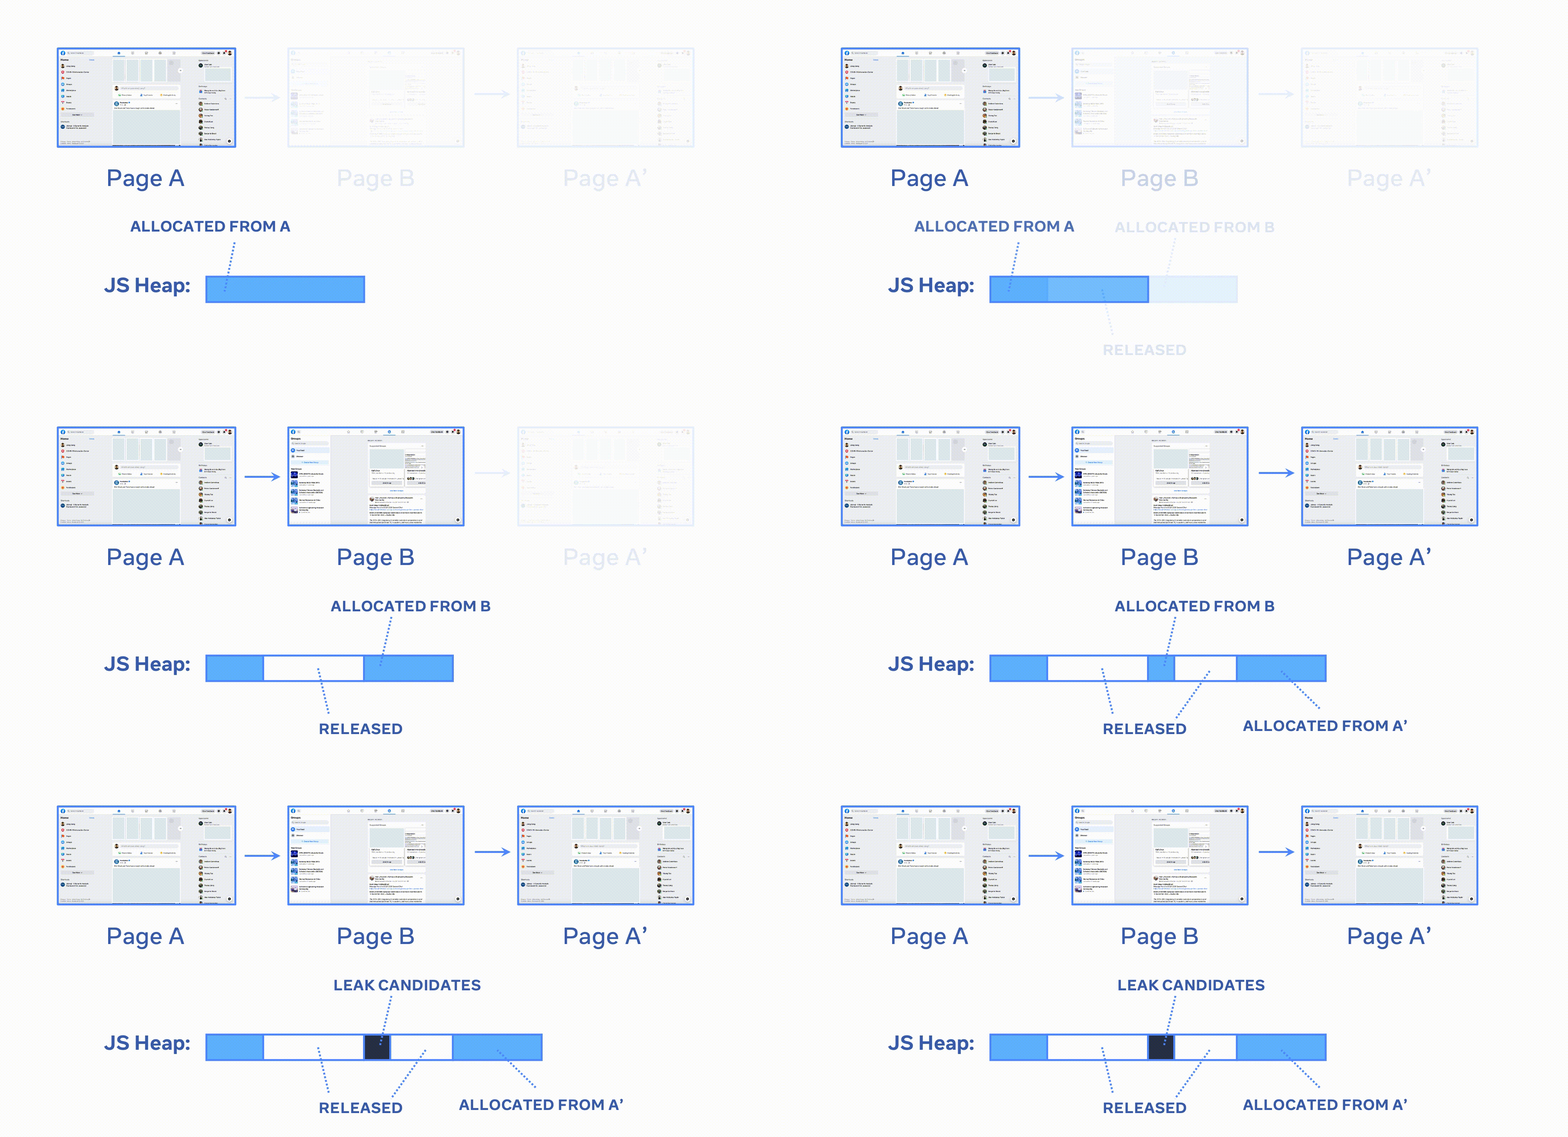
Start finding leaks in minutes
Install the CLI, point it at a page, and let memlab do the snapshot diffing for you.
$ npm install -g memlab