Detect Leaks in a Demo App
This is a tutorial demonstrating how to detect detached DOM elements with memlab.
Set up the Example Web App Under Test
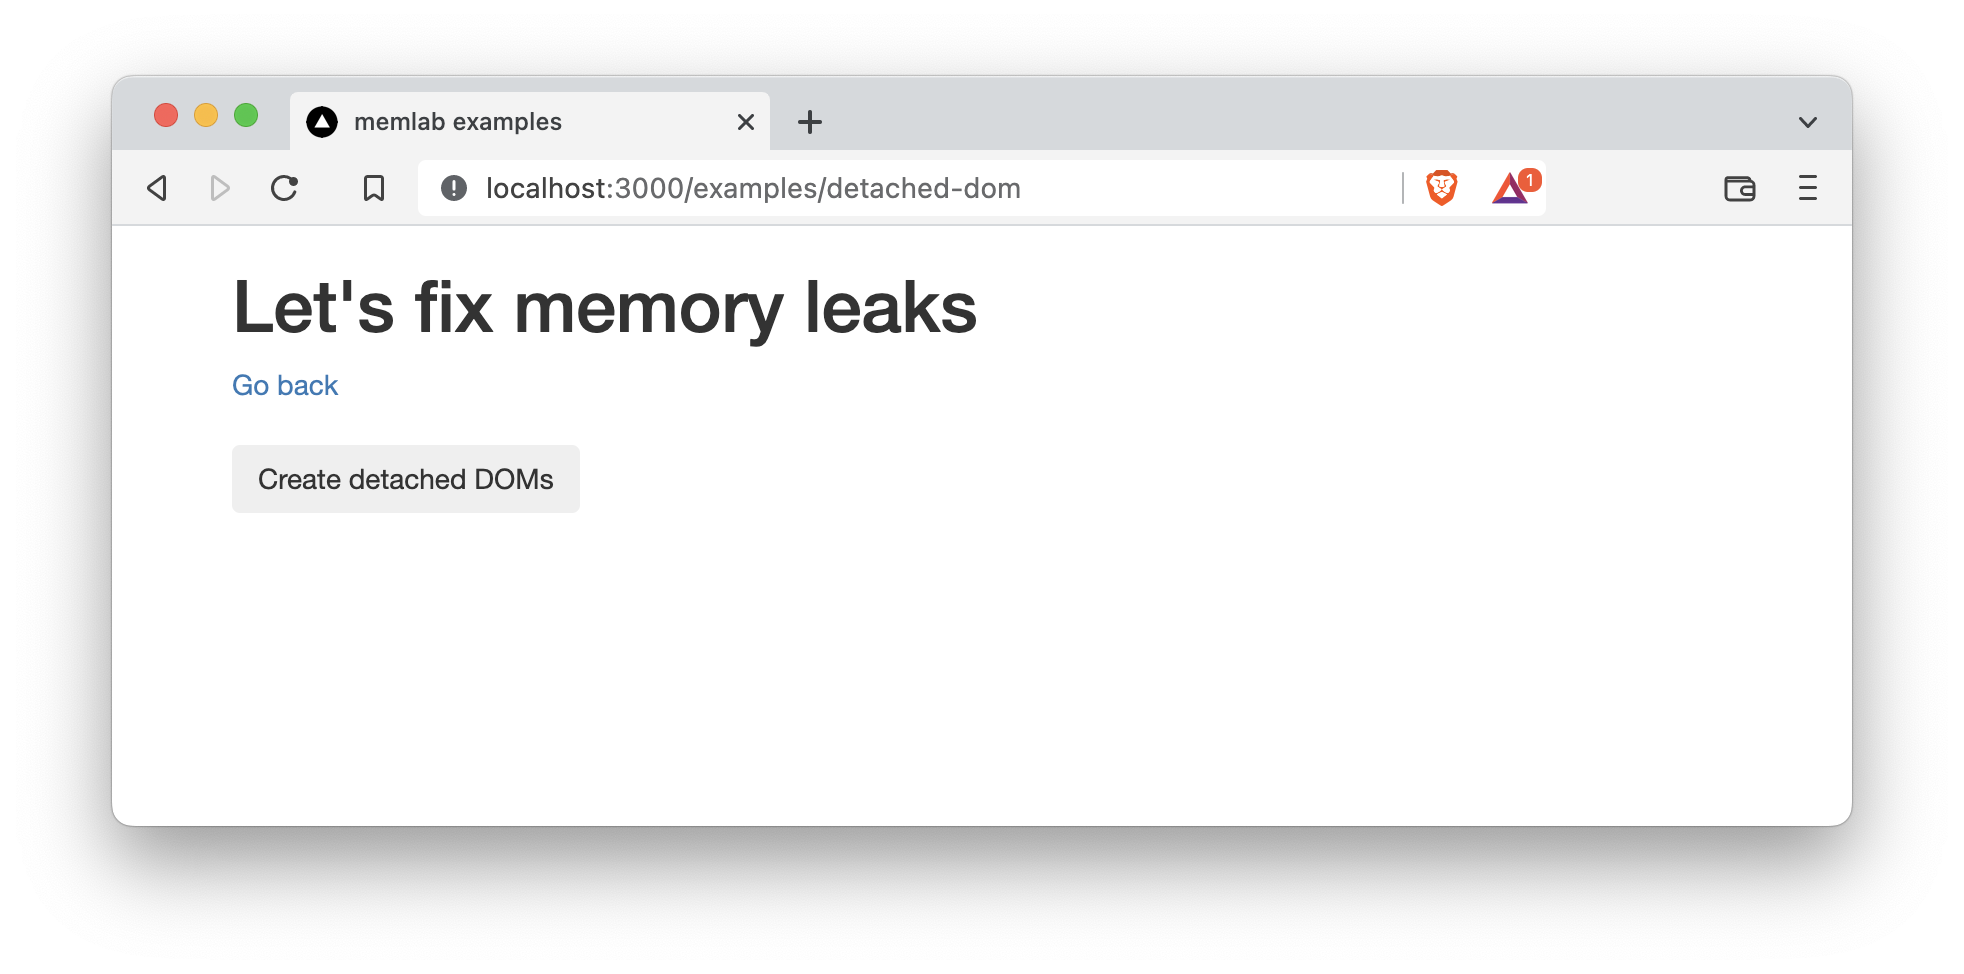
The demo app leaks detached DOM elements when you click the
"Create detached DOMs" button.
Each click creates 1024 detached DOM elements, which are referenced
by the window object.
/** * Copyright (c) Meta Platforms, Inc. and affiliates. * * @nolint * @oncall memory_lab */import Link from 'next/link';import React from 'react';export default function DetachedDom() { const addNewItem = () => { if (!window.leakedObjects) { window.leakedObjects = []; } for (let i = 0; i < 1024; i++) { window.leakedObjects.push(document.createElement('div')); } console.log( 'Detached DOMs are created. Please check Memory tab in Chrome DevTools', ); }; return ( <div className="container"> <div className="row"> <Link href="/">Go back</Link> </div> <br /> <div className="row"> <button type="button" className="btn" onClick={addNewItem}> Create detached DOMs </button> </div> </div> );}Source file: packages/e2e/static/example/pages/examples/detached-dom.jsx
1. Clone Repo
To run the demo web app on your local machine, clone the
memlab github repo:
git clone git@github.com:facebook/memlab.git
2. Run the Example App
Once you have cloned the repo on your local machine, run the following commands from the root directory of the Memlab project:
npm install && npm run build
cd packages/e2e/static/example
npm install && npm run dev
This will start an example Next.js app. Verify that it is running by visiting http://localhost:3000 in your browser:
note
The port number :3000 may be different in your case.
Find Memory Leaks
1. Create a Scenario File
/**
 * Copyright (c) Meta Platforms, Inc. and affiliates.
 *
 * @nolint
 * @oncall memory_lab
 */

// memlab/packages/e2e/static/example/scenario/detached-dom.js
/**
 * The initial `url` of the scenario we would like to run.
 */
function url() {
  return 'http://localhost:3000/examples/detached-dom';
}

/**
 * Specify how memlab should perform action that you want
 * to test whether the action is causing memory leak.
 *
 * @param page - Puppeteer's page object:
 * https://pptr.dev/api/puppeteer.page/
 */
async function action(page) {
  const elements = await page.$x(
    "//button[contains(., 'Create detached DOMs')]",
  );
  const [button] = elements;
  if (button) {
    await button.click();
  }
  // clean up external references from memlab
  await Promise.all(elements.map(e => e.dispose()));
}

/**
 * Specify how memlab should perform action that would
 * reset the action you performed above.
 *
 * @param page - Puppeteer's page object:
 * https://pptr.dev/api/puppeteer.page/
 */
async function back(page) {
  await page.click('a[href="/"]');
}

module.exports = {action, back, url};
Let's save this file at ~/memlab/scenarios/detached-dom.js.
2. Run memlab
This may take a few minutes:
memlab run --scenario ~/memlab/scenarios/detached-dom.js
3. Debug Leak Trace
For each leaked object group, memlab prints one representative leak trace.
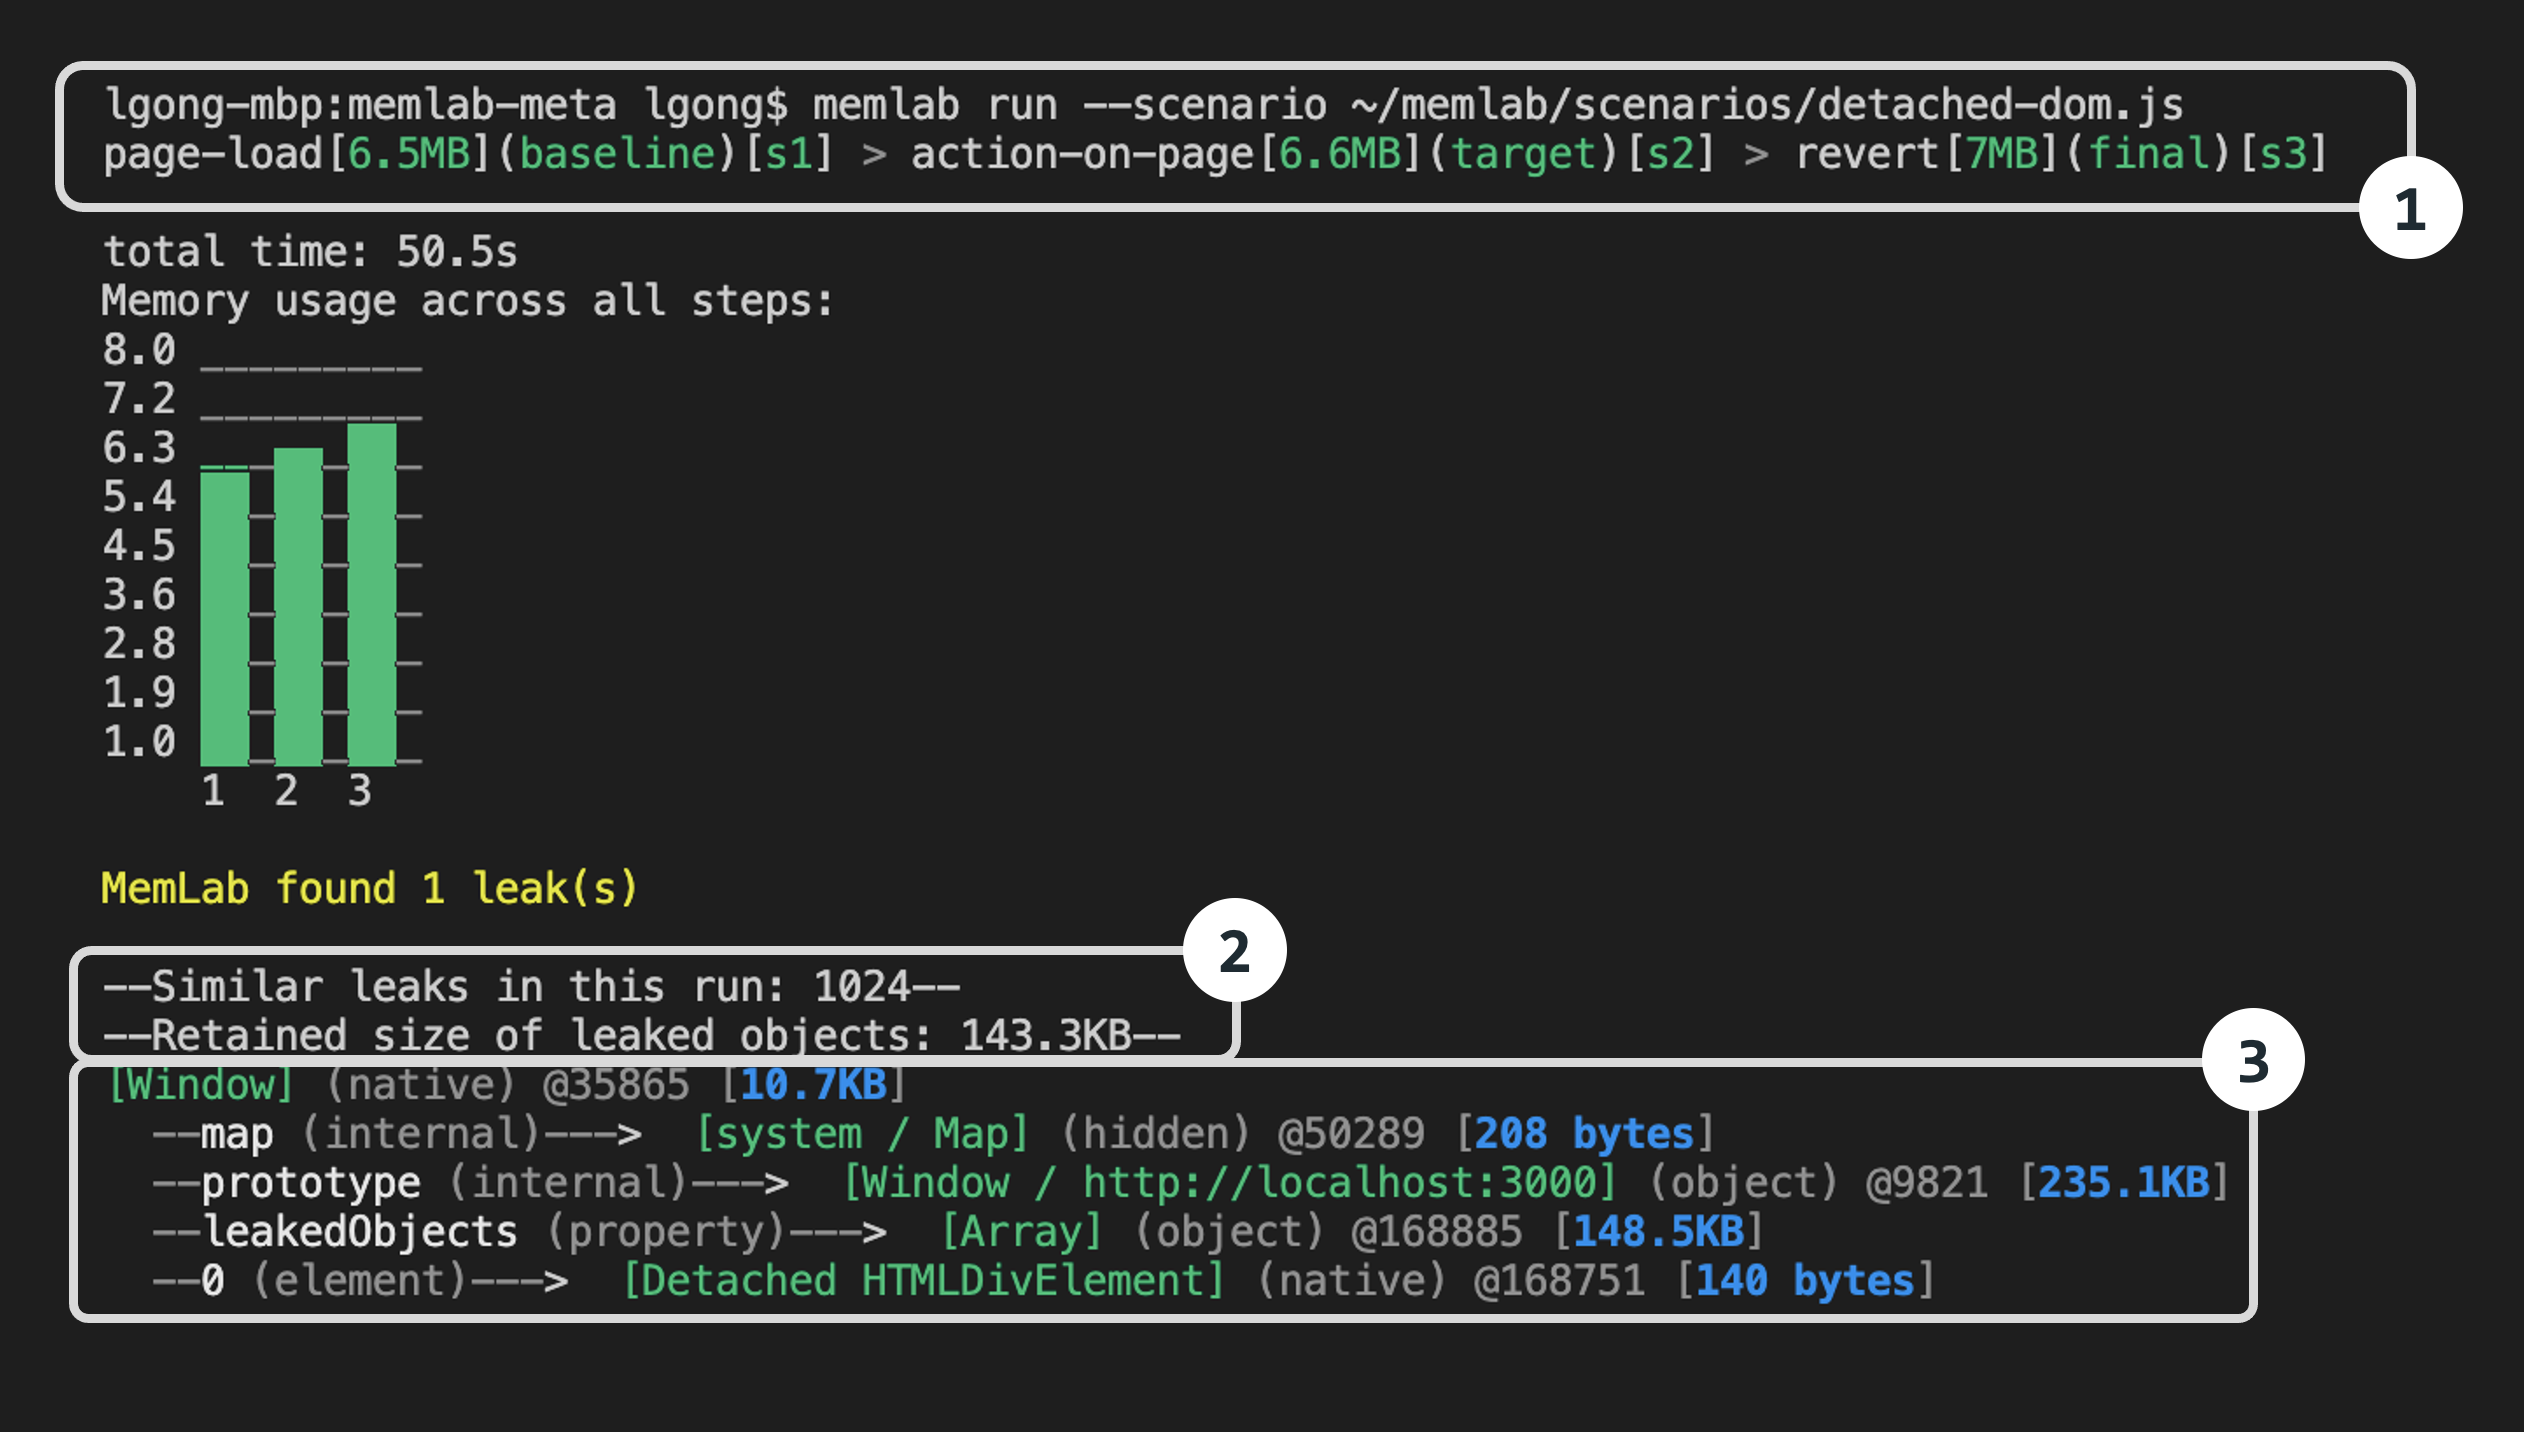
Let's break down the results from top to bottom:
Part 1: The browser interaction breadcrumb shows the
interactions (navigations) that memlab performed as specified in the scenario file.
page-load[6.5MB](baseline)[s1]- The JavaScript heap size was6.5MBon initial page load. Thebaselineheap snapshot is saved ass1.heapsnapshoton disk.action-on-page[6.6MB](target)[s2]- After clicking the "Create detached DOMs" button, the heap size increased to6.6MB.revert[7MB](final)[s3]- The heap reached7MBafter navigating away from the page that triggered the memory leak.
Part 2: Overall summary of the leak trace
1024 leaks- There were 1024 leaked objects. Line 12 of the example app created 1024 detached DOM objects in theforloop.Retained size- The aggregated retained size of the leaked object cluster is143.3KB(memory leaks are grouped together based on the similarity of their retainer traces).
Part 3: Detailed representative leak trace for each leak cluster
note
A leak trace is an object reference chain from the GC root (the entry objects in a heap graph from which garbage collectors traverse the heap) to a leaked object. The trace shows why and how a leaked object is still kept alive in memory. Breaking the reference chain means the leaked object will no longer be reachable from the GC root, and therefore can be garbage collected.
By following the leak trace one step at a time from the native Window (i.e. the GC root) downward, you will be able to find a
reference that should be set to null (but it wasn't due to a bug).
map- This is the V8 HiddenClass (V8 uses this internally to store meta information about the shape of an object and a reference to its prototype - see more here) of the object being accessed - for the most part this is a V8 implementation detail and can be ignored.prototype- This is the instance of theWindowclass.leakedObjects- This shows thatleakedObjectswas a property of theWindowobject with size148.5KBpointing to anArrayobject.0- This shows that a detachedHTMLDIVElement(i.e., a DOM element that is no longer connected to the DOM tree) is stored as the first element of theleakedObjectsarray. (Since showing all 1024 leak traces would be overwhelming, memlab prints only one representative trace — property 0 instead of properties 0 through 1023.)In short, the leak trace path from
windowobject to leaked object is:
[window](object) -> leakedObjects(property) -> [Array](object)
  -> 0(element) -> [Detached HTMLDIVElement](native)
which matches the leaking code in the example:
window.leakedObjects = [];
for (let i = 0; i < 1024; i++) {
    window.leakedObjects.push(document.createElement('div'));
}